

Ever wished your stock market analysis worked faster and with more accuracy? With the right tools, catching trends and making smart decisions becomes a lot easier. In this guide, we walk you through some popular platforms that save time and boost confidence in your choices. We dive into charting software paired with smart data tools that fine-tune your investment strategy in a rapidly shifting market. These practical tips might just change your investing game and give you an edge in the fast-paced world of stocks.
Essential Platforms for Stock Market Analysis Tools
Picking the right tool for stock market analysis can really boost how quickly and confidently you make decisions. In a market that never stops moving, tapping into real-time data and smart technical analysis is a game-changer. If you want to dive deeper, check out more on stock market analysis from our link.
When you find a tool that blends charting software with AI-powered ticker analytics, it simplifies your research and gives you a boost in investment strategy confidence.
- AlphaSense pulls insights from more than 10,000 sources. It features neat tools like Generative Search and Smart Summaries and works for both individual and enterprise users.
- The Bloomberg Terminal gives you live data and smart analytics, including BloombergGPT. It comes in at about $31,980 per year for one user.
- YCharts offers intraday quotes with a slight delay (about 90–120 seconds), half a million economic indicators, customizable dashboards, and even a free seven-day trial.
- GuruFocus is great for those into value investing. It offers handy tools like DCF and Graham calculators, along with Guru Portfolios and custom alerts.
- Finbox stands out with over 1,000 screening metrics and both built-in and custom valuation models. It starts with a free tier and moves up to a Starter plan at $19 per month.
- Koyfin offers advanced charting and real-time monitoring with a free plan that has a few dashboards and templates.
- Stockopedia uses a unique "StockRanks" system to score stocks based on quality, value, and momentum, and it comes with a 14-day free trial.
- Business Quant provides ready-to-use DCF models, deep screening, and customizable dashboards, all at competitive rates as of January 2025.
Each of these platforms is judged on its features, price, and trial offers. In essence, when you’re choosing, think about how deep the data is, how easy the charts are to use, and whether the AI tools match your style of analysis. This helps in fine-tuning your overall investment strategy.
Chart Software Solutions for Stock Market Analysis

Chart platforms bring market trends and patterns to life in real time, turning complex data into clear, visual insights. They work a bit like a digital map of the stock market, showing you exactly where things are moving at a glance. It’s similar to watching a live dashboard that makes numbers and trends feel almost tangible.
These tools come packed with a range of trading signals, from basic trend spotting to detailed backtesting across different timeframes. They’re built to be interactive, so whether you're a seasoned trader or just getting started, you can dive in and work through the data with ease.
| Chart Software | Indicators Offered | Customization Level | Pricing |
|---|---|---|---|
| YCharts | Over 4,500 metrics and nearly real-time quotes (90–120 s delay) | Highly customizable dashboards | Subscription-based with free trial |
| TrendSpider | AI-powered automation, multi-timeframe backtesting, custom alerts | Flexible indicator options | Subscription tiers |
| Koyfin | Advanced chart templates with live data feeds | Extensive layout customization | Free plan available |
| Finbox | Integrated chart modules with valuation and screening tools | Moderate customization | Pay-as-you-go plans |
Picking the right chart solution is really about finding a balance. Think about which indicators you trust, how much you want to tweak your graphs, and whether the cost fits into your trading plan. In the end, it's all about choosing a tool that feels right for your style and helps you stay one step ahead in the market.
AI-Driven Tools for Stock Market Analysis
AI is completely reshaping how we look at the stock market. In the past, digging through endless streams of real-time data could take hours; now, AI speeds up the whole process so investors get near-instant insights and clear signals to act on.
Modern platforms are smart enough to sift through market chatter and dense financial reports that were once out of reach for everyday traders. Imagine having a friendly assistant who sorts out the noise and brings you the facts when you need them the most.
Every tool has its own way of shining. For instance, LevelFields boosts strategy research by processing data up to 1,800 times faster than old-school methods. Over at StockGeist, the system taps into social media to keep an eye on more than 2,200 companies. Meanwhile, Tickeron uses an AI Pattern Search to identify breakout setups, suggest target prices, and measure confidence in trading trends. And then there’s Kavout, which combines tools like AI Stock Picker, InvestGPT, and Signal DB using a ChatGPT API, all working together in harmony. Even platforms like Incite AI, Trading Literacy, Stockinsights.ai, and Rockflow.ai add to the mix with chat-based reports and straightforward market signals that guide traders in a fast-paced environment.
These innovations bring rapid, data-driven insights to the table, making it easier to make quick decisions in volatile markets. Of course, even with fast analysis and eye-catching signals, it’s wise to mix these smart tools with traditional methods. After all, there are times when AI might not capture the full picture during wild market swings.
Investment Research Modules for Stock Market Analysis
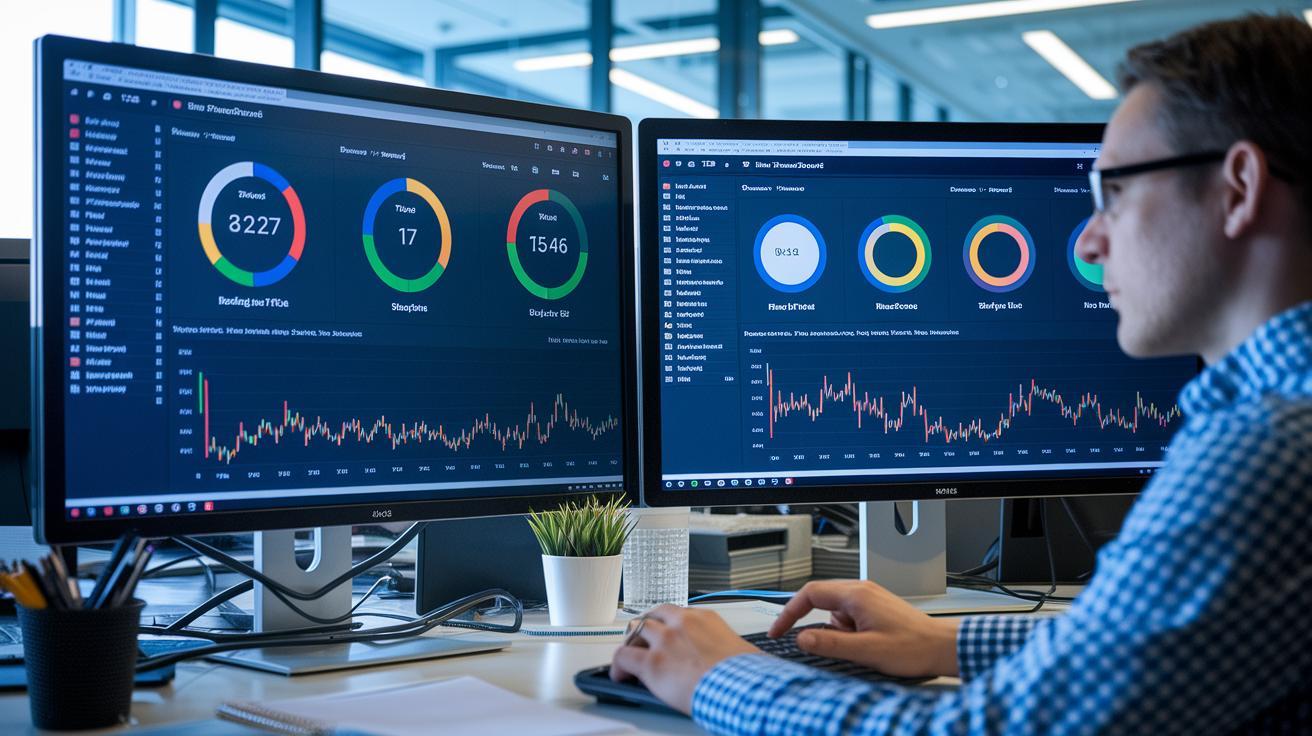
Investment research modules act like smart tools that help investors perform thorough research. They mix rich financial data with clear market indicators to cut through uncertainty and shine a light on promising opportunities.
Fundamental analysis tools dig deep into a company’s financial health using methods like discounted cash flow (DCF) models and ratio calculators. Investors can set up custom alerts and scenario models to keep a close eye on performance, which makes spotting important shifts much easier. Fun fact: Before a regional retailer’s big turnaround, detailed DCF analysis over several quarters hinted at the recovery ahead.
Quantitative platforms take vast amounts of data and turn it into practical insights that rank stocks by quality, value, and momentum. Case studies reveal that investors often use custom screens and performance scores to zero in on promising stocks, especially during market transitions.
Pairing fundamental and quantitative modules creates a balanced framework for stock analysis. This approach combines detailed financial insights with broader performance indicators. For instance, one investor used ratio calculators alongside quantitative screens to identify undervalued stocks that later posted strong growth, proving the strength of an integrated method.
Free and Budget-Friendly Tools for Stock Market Analysis
Free tiers and trial periods offer a simple, low-risk way to experiment with essential features while comparing costs and real user experiences. For instance, one trader once took advantage of a free trial to test powerful screening tools and later confirmed that the platform fit perfectly into her workflow.
If you need reliable market data without spending a dime, Yahoo Finance and Morningstar consistently deliver up-to-date screeners, news, and accurate figures at no charge. Meanwhile, Koyfin gives you access to basic dashboards and chart templates on its free tier, a great entry point if you’re just starting out. Detailed user feedback even suggests that these free tools can sometimes match the performance of their paid counterparts, making them perfect for casual market analysis.
For those interested in more advanced functionalities, Business Quant, YCharts, and GuruFocus provide trial periods lasting from seven to fourteen days. This lets you explore complex modeling and screening modules firsthand. One user, for example, discovered that Business Quant offered clearer insights into market shifts during a trial than YCharts did. Taking the time to compare each platform’s features and costs during these trial runs can really help you decide which tool fits your trading style best.
Advanced Screening Techniques for Stock Market Analysis

Advanced screening helps traders spot promising trade setups before traditional methods even catch a hint. Tools like Tickeron’s AI Signal Agents deliver near-instant alerts on buying or selling chances. Finbox, for instance, offers more than 1,000 screening metrics and flexible filters that make it easy to sift through large amounts of data. And platforms such as GuruFocus and Stockopedia provide ready-made screens modeled on strategies from legendary investors, helping traders quickly find stocks with potential and adjust their portfolios as conditions change.
Algorithm-based systems use real-time data processing and sophisticated AI to send out immediate trading signals. Tickeron is a clear example of this, using smart algorithms to track market moves. On the other hand, rule-based screeners like TrendSpider give you a structured setup for backtesting by relying on predetermined criteria and historical data. Each method comes with its own benefits: algorithm-based tools excel in fast-changing markets, while rule-based systems offer reliable consistency and a chance to review past performance. Depending on your trading style, combining these approaches might give you a deeper insight into market trends.
Customizing your screening tools to fit your trading strategy is key. It’s a good idea to backtest your screens on platforms like Business Quant and TrendSpider regularly to ensure your filters keep up with market changes. Spending time to review and fine-tune these systems is like tuning a well-oiled machine, it keeps your trading strategy sharp and effective as the market evolves.
Real-Time Dashboards for Stock Market Analysis
Active traders need data at their fingertips to grab opportunities as soon as they pop up. In a world where market shifts happen in a flash, live dashboards are essential because they show real-time snapshots of price changes, trading volumes, and how much the market is moving. For example, platforms like Bloomberg Terminal stream up-to-the-minute quotes and data insights so investors can act right away. Essentially, quick data feeds let traders ride market trends and tweak their positions faster than ever.
The best dashboards pack in interactive tools like heatmaps, layered charts, and personalized alerts. Take AlphaSense, it rolls out live updates with clear Smart Summaries and a simple search function, while TrendSpider gives automated alerts and backtesting visuals across different timeframes. Koyfin offers real-time monitoring widgets and custom watchlist notifications, and Tickeron highlights live pattern alerts along with target-price signals. Then there’s Incite AI with its “Live Intelligence” feed that crunches thousands of data points worldwide, painting a complete picture of the market’s mood.
Moreover, the ability to use these tools on both desktop and mobile is a must. Whether at a desk or on the go, traders can tap into real-time data and interactive dashboards easily. This seamless integration ensures that no matter where you are, you stay connected and in the loop with the pulse of the market.
Selecting and Integrating Tools for Stock Market Analysis

When starting out, it’s all about figuring out what you need from a tool. Think about whether you’re day trading, swing trading, or planning to hold stocks for the long run. Look into key factors like how accurate the data is, how often it updates, and the range of assets it covers. For a deeper dive into setting up your system, check out our guide on what market analysis is.
Next, match the tool to your trading style. If you’re someone who relies on live charts and quick indicators, go for a platform that shines in technical analysis. But if you lean toward understanding the fundamentals of a company, choose a tool that offers ratio calculators and thorough financial reports. It’s smart to compare costs, trial periods, and the level of customer support to see if it fits your needs.
Then, give it a test run. Take advantage of free or low-cost trial periods and see how the tool performs in real time. Experiment with its interface and check if it handles live data as promised. This hands-on trial can be a real eye-opener before you commit long term.
Finally, make sure your new tool integrates smoothly with what you already use. Look at how it connects, through APIs, spreadsheet exports, or broker links. Organize a few training sessions or pilot projects to get everyone comfortable with the setup. And don’t forget to periodically review your integration strategy so that it keeps pace with the ever-changing market. This thoughtful approach not only streamlines your workflow but also lays a solid foundation for lasting success in the stock market.
Final Words
In the action, we explored essential platforms, innovative chart software, AI-driven tools, research modules, free resources, advanced screening techniques, real-time dashboards, and effective integration strategies.
Each section highlighted the strengths of these tools for stock market analysis, providing actionable insights for evaluating features, pricing, and trial options.
We wrapped up with strategies to match these platforms with your trading style, paving the way for smarter, data-driven decisions. Stay curious and keep refining your approach for better market performance.
FAQ
Q: What are some free tools for stock market analysis?
A: The free tools for stock market analysis include platforms like Koyfin’s free tier, Finbox’s complimentary version, Yahoo Finance, and Morningstar, which offer real-time data and basic charting to help you evaluate market trends.
Q: Which are the best tools and websites for stock market analysis?
A: The best tools for stock market analysis range from premium platforms such as Bloomberg Terminal and YCharts to accessible sites like GuruFocus and Stockopedia, offering advanced analytics and comprehensive research data to suit various needs.
Q: What are the best stock research tools for beginners?
A: The best stock research tools for beginners include user-friendly options like Finbox, GuruFocus, and Stockopedia, which offer intuitive interfaces, accessible valuation models, and trial periods that help build essential market analysis skills.
Q: What is the 3-5-7 rule in stocks?
A: The 3-5-7 rule in stocks refers to a guideline some traders use to assess performance over short, medium, and near-term periods, though its specifics may vary and it isn’t a universally adopted standard.
Q: Can ChatGPT analyze the stock market?
A: ChatGPT can analyze the stock market by offering insights, historical context, and trend interpretations, but it does not access real-time data, so its analysis should be supplemented with current market research.