

Ever thought Airbnb hosting might be more profitable than you imagined?
When you stack up Airbnb, VRBO, and Booking.com, smart pricing and strong numbers often reveal profit margins that surprise even seasoned hosts.
This piece dives into key factors like occupancy rates and seasonal trends that signal steady growth. The insights offer a clear view of how you can boost returns while keeping costs in check.
So if you’re a host or investor curious about these trends, you’ll see that clear, solid data can help shape strategies for true financial wins.
Airbnb Market Overview and Key Performance Indicators

In 2025, the Airbnb market analysis digs into how hosts and investors can excel by comparing listings across Airbnb, VRBO, and Booking.com. They look at properties in terms of size, location, and what amenities they offer. Key numbers like property prices, average daily rates (ADR), occupancy rates, revenue per available rental (RevPAR), operating expenses, and profit margins all play a big role. Imagine a host who tracks an ADR of $150 while noting a local competitor with lower fees, such details can point to a high-return opportunity.
We also see clear trends in occupancy and seasonal changes that shape rental cycles throughout the year. For example, occupancy might peak in the summer and slow down in winter. One host adjusted pricing based on these seasonal patterns and boosted profitability by almost 20%. That kind of insight shows how actionable data can improve pricing and promotion strategies.
Before diving into the numbers, it’s important to set clear investment goals and budget limits. Understanding local rental markets means knowing the legal rules that change from state to state, county to county, and city to city. A host in one area might deal with strict rules, whereas another in a more relaxed market might enjoy greater flexibility. For instance, when comparing two similar coastal properties, the one with easier permitting might earn better profit margins even if both have similar market rates.
By studying these performance indicators, hosts get a snapshot of current market conditions. This also lays the groundwork for long-term strategy. When hosts back solid data with clear investment goals, they’re in a better position to adapt their strategies, boost their competitive edge, and improve profitability, no matter the market conditions.
airbnb market analysis: Positive Market Outlook

Airbnb market analysis paints a picture of strong growth, with more guests checking in and higher earnings across many property types. The data suggests a trend: travelers are choosing rentals that offer plenty of room, privacy, and a mix of useful amenities. This shift is boosting several niche markets.
Hosts in the short-term rental world are noticing key indicators rising, from cozy spots in small cities to luxurious urban escapes. For instance, suburban homes and larger properties are attracting families and busy professionals, while pet-friendly rentals remain extremely popular. Evolving guest preferences, like the need for extra space and a homey atmosphere, are opening up exciting opportunities for hosts who track their rental revenue closely.
| Growth Trend | Market Segment | YOY Occupancy Change | YOY RevPAR Change |
|---|---|---|---|
| Small Cities | Emerging urban hubs | +4% | +3% |
| Pet-Friendly Listings | Properties welcoming animals | +5% | +4% |
| Suburban Homes | Family-oriented stays | +6% | +5% |
| Larger Properties | Extra space and amenities | +7% | +6% |
| Luxury Segments | Upscale properties | +3% | +2% |
| Regulation-Friendly Markets | Stable legal areas | +4% | +3% |
Looking at these numbers, there are clear opportunities in the market. It’s like noticing the unique energy of a neighborhood; even small cities are quietly drawing interest with a steady community buzz. By tracking occupancy and revenue trends closely, hosts can fine-tune their listings and strategies to stand out in a competitive space. In fact, this focus on data helps pinpoint where the strongest growth is happening.
Competitive Landscape in the Airbnb and Short-Term Rental Sector
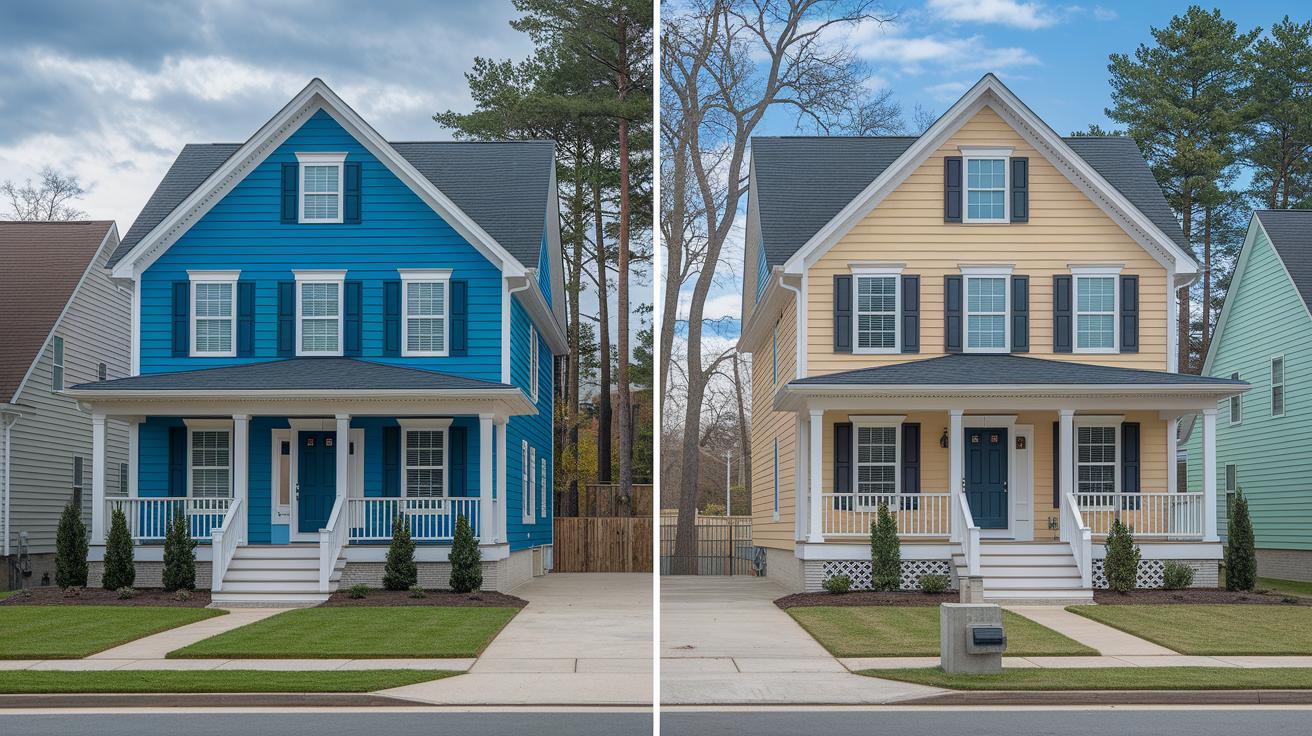
When comparing market share among Airbnb, VRBO, and Booking.com, hosts focus on a few key factors that drive performance. They look at pricing strategies, the variety of amenities, where listings are located, the overall quality of the listing, and, of course, guest reviews. Picture two similar homes in the same neighborhood, one offers high-speed internet and smart home features, while the other sticks to the essentials. That little extra makes a difference in which property guests choose, impacting occupancy rates.
Keeping an eye on competitor occupancy rates and what guests prefer helps sharpen your positioning in this competitive space. One host even mentioned that tweaking prices based on what guests said about competitors led to a clear boost in bookings. Sometimes, small changes, like fresh photos or a more flexible cancellation policy, can really lift guest satisfaction and overall performance.
Key points to consider include:
| Factor | Impact |
|---|---|
| Pricing | Staying competitive can drive more bookings. |
| Amenities | Offering quality and variety sets you apart. |
| Guest Feedback | Positive reviews build trust and improve metrics. |
This kind of competitor analysis not only shows you what works but also highlights gaps in the market. By regularly comparing these elements, hosts can adjust their approach, sharpen their listings, and ultimately grab a stronger piece of the market share.
Forecasting Revenue and Profitability for Airbnb Listings

Forecasting revenue and profitability can really change how you run your Airbnb business. Start by setting clear investment goals and a solid budget. It's like planning a road trip, you pick your destination and work out fuel costs before you set off.
Next, take a close look at local rentals to find your ideal market. Picture yourself scrolling through listings, spotting properties that match yours in size and features. This helps you uncover hidden chances to boost your earnings. Then, pay attention to seasonal shifts and guest demand. You might notice summers fill up fast while winters are slower, which is key for tweaking your rates.
Also, check out what your competitors charge, including their fees and occupancy levels. Think of it like comparing two recipes: you see what ingredients work best, and then you adjust your own mix. Tools like AirDNA, PriceLabs, and AllTheRooms give you precise numbers that support your choices.
Finally, make good use of the Futurestay Competitive Assessment Worksheet. It’s like a roadmap that lets you simulate different market scenarios, keeping your strategy both flexible and data-driven. In the end, these steps not only fine-tune your income estimates as a host but also help your rental perform better overall.
Tools and Data Sources for Airbnb Market Analysis

Platforms like SummerOS, Mashvisor, Wheelhouse, and PriceLabs provide hosts and investors with clear, actionable data. They reveal everything from active listing numbers to detailed nightly rates and occupancy forecasts, making it easier to spot where demand is strongest. Picture using a tool that shows you RevPAR analytics alongside seasonality charts in real time, it's like having a handy guide to market performance right at your fingertips.
Each tool brings something special to the table. SummerOS shines with its easy-to-read dashboards that visualize market trends, while Mashvisor dives deep into past trends and future predictions. Wheelhouse mixes occupancy data with smart pricing strategies, and PriceLabs fine-tunes prices using real-world factors.
For those who need larger datasets, specialized APIs like AirDNA and AllTheRooms are ready to help. They offer heaps of data, streamlining detailed analysis over many rental markets. With these tools, hosts can confidently adjust their pricing strategies and boost listing performance by spotting shifts in guest preferences. This data-first approach is a must-have for anyone wanting to stay ahead in the fast-paced short-term rental market.
Regional and Seasonal Variations in Airbnb Market Performance
Recent figures show that Airbnb hosts in smaller cities with relaxed short-term rental rules enjoy up to 15% higher occupancy in the summer compared to those in big cities facing tougher limits. For instance, one host saw occupancy jump from 45% during winter to 78% in summer during Q2 2023, an impressive boost tied to friendlier regulations.
It’s clear that local rules are making a big difference. Towns with fewer restrictions not only face less competition but also keep a steady stream of bookings even when demand usually dips.
| Location Type | Average Summer Occupancy (%) | Average Winter Occupancy (%) |
|---|---|---|
| Smaller Cities | 78 | 45 |
| Metropolitan Hubs | 62 | 38 |
This data shows that wherever regulations are lighter, hosts are more likely to see dynamic seasonal growth and consistent off-peak performance.
Final Words
In the action, we broke down Airbnb market analysis into digestible insights, reviewing key performance indicators, rental trends, competitor assessments, revenue forecasting, and the best data tools available. Each section offered a clear look at listing performance and seasonal impacts, providing practical steps for setting investment targets and budget limits. The discussion tied market data to real-world applications, giving hosts and investors a straightforward snapshot of opportunities. Here's to moving forward with confident, informed steps in a competitive market.
FAQ
What does the Airbnb market analysis template provide?
The Airbnb market analysis template provides a step-by-step guide to compare similar listings, assess pricing strategies, and measure performance against key market benchmarks for smarter investment decisions.
What is an Airbnb market analysis calculator?
An Airbnb market analysis calculator computes key metrics like average daily rates, occupancy, and revenue per available rental to help hosts forecast earnings and adjust pricing strategies.
Which Airbnb analytics tool offers the best insights, including free options and AirDNA alternatives?
Leading tools like PriceLabs, Wheelhouse, and various AirDNA alternatives deliver detailed analytics on occupancy trends and pricing, with free versions available for initial market data exploration.
Why are people no longer using Airbnb?
Some hosts and guests shift away from Airbnb due to rising fees, increased competition, and tighter local regulations that affect profitability and the overall rental experience.
How does one analyze an Airbnb market?
Analyzing an Airbnb market involves comparing local listings, studying competitor pricing, and reviewing key performance metrics like occupancy, revenue, and seasonal trends for informed decision-making.
What does the 80 20 rule for Airbnb signify?
The 80 20 rule for Airbnb suggests that 80% of bookings typically come from 20% of listings, highlighting the impact of top-performing properties on overall market success.
Is Airbnb still profitable in 2025?
Current trends indicate that Airbnb can remain profitable in 2025 if hosts focus on enhancing listing quality, adapting to market fluctuations, and utilizing effective pricing and marketing strategies.
How do Airbnb viability and performance data influence potential returns?
Airbnb viability is gauged through performance data such as revenue, occupancy, and regulatory impacts, helping hosts and investors assess market strength and predict sustainable profit potential.