

Have you ever felt like the crypto market is as unpredictable as flipping a coin? Each price shift carries its own digital pulse, hinting at where investors stand. In this post, we break down the key numbers behind market events and trends, everything from Bitcoin’s movements to shifts in altcoins. Stick with us to discover clear insights that can sharpen your crypto approach.
Key Metrics and Trends in Crypto Market Analysis

When we look at the crypto market today, it’s all about blending fundamental insights, technical analysis, and on-chain data. Right now, Bitcoin has dropped below $106,000, SUI is down 9%, Chainlink slipped by 10%, Stellar holds steady at $0.277, and ICP declined by 5.5%. These shifts remind us that keeping an eye on volume changes is key; it’s like tracking a digital pulse that tells you how investors are feeling.
Big moves are constantly reshaping the scene. On October 27, 2025, Gate Ventures picked up ADEN, sparking talk about fresh market entries. Meanwhile, Polkadot’s DOT joined forces with Unity Nodes, and Tom Lee’s BitMine injected an extra $300 million in Ether, bumping its total to $13.7 billion. Other events like WebZero’s $41K hackathon and LBank’s $1B talent program show a real commitment to tech innovation and team growth. Even Swiss crypto bank AMINA stepped up by securing a MiCA license, hinting at a more mature and regulated environment.
Savvy investors dig deeper than just price tags. They’re tapping into on-chain data, like transaction counts, active addresses, and liquidity metrics, to get the full picture. Imagine a trader checking activity logs to spot big wallet shifts; such moves often hint at upcoming price changes. This well-rounded approach effectively weaves together classic price analysis with the real-time signals of the digital world.
Fundamental Analysis Techniques for Crypto Market Evaluation

Begin by diving into the cryptocurrency’s white paper. This document is more than just technical jargon, it walks you through the technology, project roadmap, and tokenomics, covering details like supply, distribution, and utility. Imagine opening a white paper that reads, “Our token distribution is designed to reward active participation, with clear usage scenarios laid out over the next five years.” That kind of information not only helps you value a digital currency but also guides you in assessing its technical strengths.
Next, shift your focus to the team behind the project. Look at the credentials and leadership track records, ask yourself, “Have they handled similar projects before?” A strong, experienced team can be likened to a seasoned captain guiding a ship through stormy seas. If you see a leadership group known for their work in the field, it’s a good sign that the project might have long-term potential.
Also, pay attention to marketing efforts and community engagement. These provide clues about the broader economic impact of the cryptocurrency. Real-life examples can help here: consider how Avalanche’s infrastructure upgrades, Hedera’s impressive Hashgraph performance, or LEO Token’s smart dual-chain revenue model have driven positive momentum. Looking at these cases, you get a clear picture of fundamental evaluation in action. For a deeper dive into these market analysis ideas, check out what is market analysis.
Crypto Market Analysis: Elevate Your Investing

Technical Chart Patterns
Technical chart patterns are like roadmaps for understanding market behavior. By looking at past price movements and trading volumes, you can start to guess where the market might head next. One practical tool is the candlestick chart, which displays little red and green markers. For example, if you see a doji, a candlestick that signals indecision, during an uptrend, it could mean a brief pause before prices take off again.
Moving averages are another helpful guide. When a short-term average crosses over a long-term one, it often hints at a change in momentum. Conversely, if the short-term line dips below the long-term average, it might signal a downturn. And then there’s volume analysis: imagine a situation where prices jump alongside a sudden spike in volume, it shows strong buyer activity driving up the price.
Trendlines also play a key role. They draw clear support and resistance levels, and when these lines are broken, it can mark a shift in market sentiment. Here’s a quick rundown of what to watch for:
- Identify critical support and resistance regions.
- Keep an eye on moving averages like the 50-day and 200-day lines.
- Spot unusual candlestick formations that stray from the current trend.
- Monitor any sudden changes in trading volume.
On-Chain Data Insights
On-chain analysis is all about diving into blockchain data to get a real-time read on market mood. One important metric is wallet activity. A rise in the number of active wallets can often signal that more players are entering the market, paving the way for price movements. Similarly, high transaction volumes usually come hand-in-hand with market growth.
It’s also useful to look at miner behavior. Changes in how miners move their coins can sometimes give early clues about shifts in network activity or liquidity. Then there are exchange reserves: falling reserves may suggest that investors are holding onto their assets, possibly anticipating a rise, while increasing reserves might hint at selling pressure.
When you combine these on-chain insights with traditional chart analysis, you build a much clearer picture of market dynamics. This blend of visible trends and underlying blockchain signals ultimately leads to more informed and timely investment decisions.
Predictive Price Modeling and Risk Assessment in Crypto Market Analysis
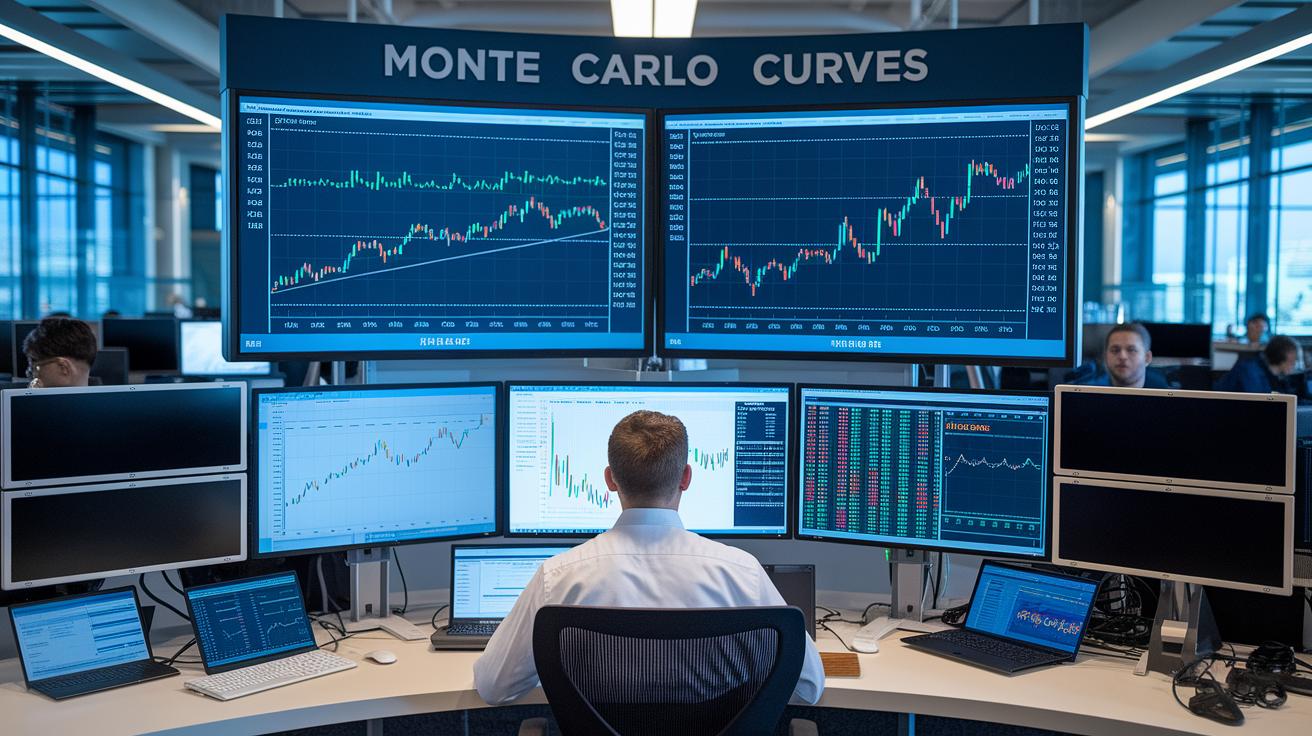
Understanding key factors like market cap, liquidity, adoption rates, and historical volatility is crucial for predicting price movements. Simple models like ARIMA and LSTM learn from past trends to give us a peek into the future. Imagine an investor saying, "The ARIMA model hinted at a possible dip just when liquidity spiked." That’s a clear example of how these models can forecast market shifts.
Traders also use tools like correlation matrices and Monte Carlo simulations to run different scenarios. Essentially, these methods help spot warning signs of volatility and possible market corrections. By breaking down risks across different market cap levels, these scenarios make it easier to see where potential trouble might lie.
Risk management is just as important. Smart strategies mix things up by diversifying portfolios, carefully sizing positions, and setting stop-loss measures. Picture this: A trader, after checking how their portfolio holds up against sudden regulatory changes, tweaks their position sizing to keep both risk and opportunity in check. That kind of hands-on risk assessment keeps investors ready for anything.
Finally, stress testing for unexpected news or regulatory shifts helps investors make quicker, better decisions. Combining forecasting methods with solid risk management is key to navigating this fast-moving, data-driven crypto market.
Tools and Strategies for Comprehensive Crypto Market Analysis

Imagine a toolkit that blends basic market data with cutting-edge on-chain insights, offering you a full picture of the crypto market. One key tactic is pairing live price dashboards with multi-exchange aggregators. These tools keep you updated in real time with clear charts and graphs that turn raw data into easy-to-understand visuals. Picture a trader checking a dashboard that clearly marks support levels, resistance lines, and even tracks active wallet numbers.
Real-world examples back up these strategies. For instance, Tom Lee’s BitMine shifted gears by adding $300 million in Ether. This move shows how dynamic trading signals, like simple buy-sell alerts, can help spot shifts as they happen. Adding index-based diversification is another smart move to cushion token-specific risks. In other words, using comprehensive analytics is vital.
New capabilities are always emerging to help make better decisions. Mobile apps now send push alerts with personalized updates, ensuring you never miss a critical market twist. Plus, smooth tool integration lets you mix and match resources, whether you’re using on-chain tools like Glassnode or Dune, or even a custom solution meant for your unique trading style.
These methods give investors a way to combine traditional market analysis with modern tech, keeping them nimble in a rapidly shifting environment.
Final Words
In the action, we broke down crypto market analysis by combining key metrics, on-chain data insights, and technical chart patterns. We explored essential frameworks that unite fundamental evaluations with predictive price modeling and proper risk management.
We also touched on practical tools and strategies that can help refine decision-making. Every step of our discussion aims to empower professionals with actionable insights and a solid foundation for better strategy. Keep these insights in mind as you shape your next move in the ever-changing digital market.
FAQ
What does free crypto market analysis offer?
Free crypto market analysis provides no-cost insights combining technical, fundamental, and on-chain data, giving users an accessible snapshot of digital asset trends.
What is a crypto market analysis chart?
A crypto market analysis chart displays price, volume, and trend data visually, enabling quick interpretation of market movements with tools like moving averages and historical data overlays.
What does crypto market analysis today involve?
Crypto market analysis today involves reviewing live data, recent price trends, and strategic events, which together help traders quickly assess market directions and current dynamics.
Where can I find the best crypto market analysis?
The best crypto market analysis comes from platforms that integrate technical, fundamental, and on-chain data, offering comprehensive, real-time insights that support informed trading decisions.
How does crypto market analysis AI function?
Crypto market analysis AI employs advanced algorithms to process historical and real-time data, identify market trends, and forecast price movements to assist in strategic trading choices.
What defines the cryptocurrency market today?
The cryptocurrency market today is defined by its rapid price shifts, strategic trading events, and a blend of on-chain metrics and technical indicators that shape investor perceptions.
What are the best live crypto charts available?
The best live crypto charts provide updated visuals on prices, volumes, and key technical indicators, empowering traders with the real-time data needed for agile decision-making.
Why is the cryptocurrency market down today?
The market might be down today due to factors like regulatory news, shifts in investor sentiment, and changes in key metrics, which together contribute to a decline in digital asset prices.