

Ever wondered if clear market signals can set you on the path to reliable growth in your trading journey? Futures market analysis gives you a simple look at current market trends with real-time quotes and easy-to-read charts that cut through the clutter. This method reveals unmistakable patterns and practical ways to manage risk along the way. In short, wise traders use these signals to time their moves and safeguard their investments, paving the way for steady and smart growth, even when the market feels unpredictable.
Futures Market Analysis: Bold Trends Signal Growth
Traders can tap into live futures quotes, interactive charts, and exchange contracts right away. This real-time data helps cut through the noise so you can see clear market signals, almost like watching a digital gauge update every time there’s a shift.
A step-by-step guide walks you through technical chart patterns and basic economic indicators, giving you a solid framework for understanding market trends. Think of it as using tools like regression analysis, which shows how volume trends and price movements are linked, offering a closer look at potential growth areas. Smooth moving averages filter out random ups and downs, while clear chart patterns highlight breakout opportunities, setting the stage for smart investment moves.
Traders also focus on risk control to protect their positions. With careful position sizing and stop-loss setups that work with market depth insights, you can set clear entry and exit points. This method, mixing strong technical clues with solid risk management, is a bit like strapping on a safety harness before taking a daring leap.
Moreover, using quantitative techniques like Monte Carlo simulations can paint a picture of different future scenarios. When these methods blend with basic economic insights, say, from economic calendars and key market indicators, you get a complete look at market trends. For a deeper dive into the basics of market analysis, check out this guide: How to Perform Market Analysis.
Technical Chart Patterns in Futures Market Analysis
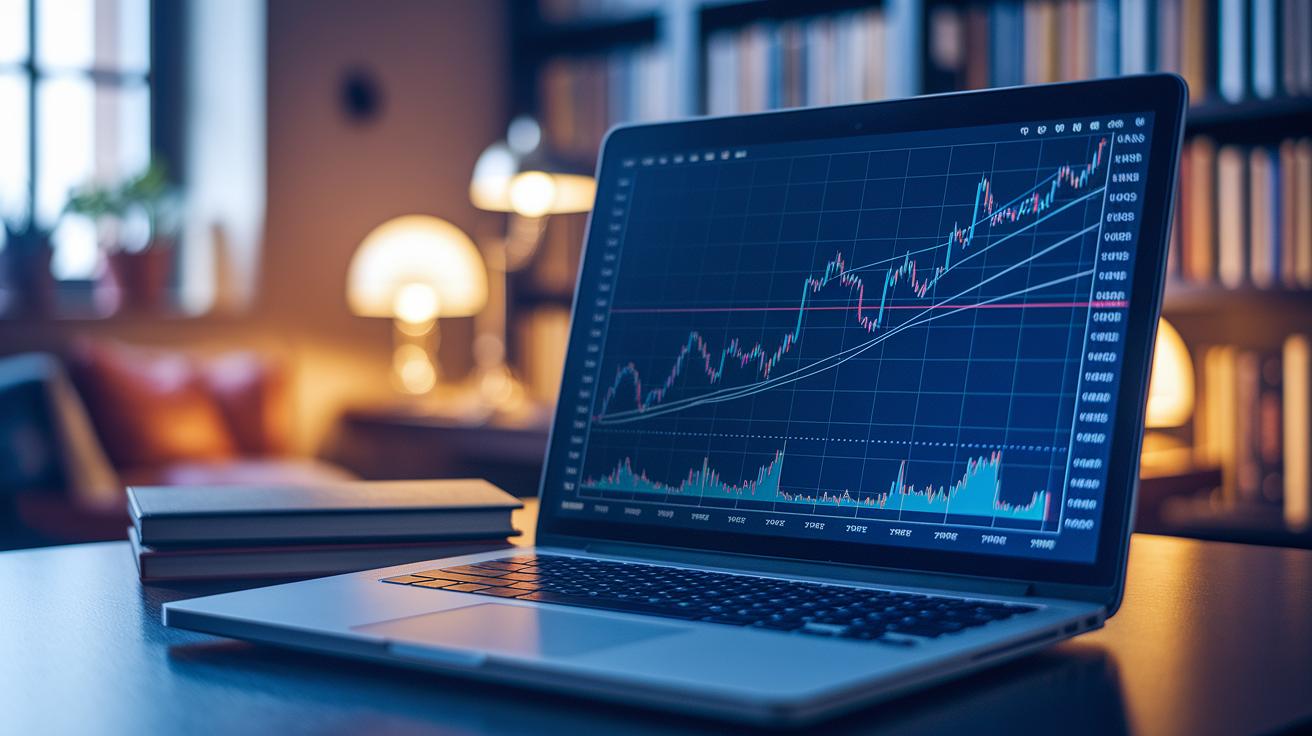
Chart patterns are vital tools for traders who want to understand price moves and foresee what might come next. Focusing on these setups lets traders time their entries and exits more precisely, especially when they watch key support and resistance levels for clear signals. Moving averages help smooth out the erratic price swings, revealing the real trend underneath. And the Elliott Wave Theory adds a broader view by shedding light on long-term market sentiment.
Here are six major pattern types to watch:
-
Ascending Triangle – This pattern appears when a flat, horizontal resistance line meets a rising support line, hinting that prices could break upward.
-
Descending Triangle – In this case, a horizontal support line is paired with a falling resistance trend, often pointing to continued bearish moves.
-
Expanding Triangle – With trendlines that diverge, this setup signals larger price swings and increased volatility, so timing your trade entries is key.
-
Symmetrical Triangle – Formed by trendlines that converge at equal angles, this pattern typically marks a period of consolidation that usually leads to a breakout in either direction.
-
Flag and Pennant Patterns – These short-term formations follow a strong price move, acting as brief pauses before the prevailing trend takes over again.
-
Wedge Pattern – Here, converging trendlines slope in the same direction, often serving as a warning that the current trend might soon reverse.
Keep an eye on support and resistance levels alongside these chart patterns to fine-tune your trading decisions. Together, they provide actionable insights that help you better time market entries and make futures market analysis a more cohesive process.
Fundamental Analysis Drivers in Futures Market Analysis
Economic indicators lay the groundwork for understanding trends in futures trading. Data like GDP numbers, employment stats, and inflation rates give us a clear snapshot of market sentiment. When a figure comes in better than expected, you might see noticeable moves in sectors such as energy, agriculture, or metals. For example, strong GDP growth can nudge traders to reconsider their bullish bets, while a sudden spike in inflation might hint at tighter margins for commodity producers.
Integrating an economic calendar into your analysis routine is a smart move. Keeping an eye on scheduled events helps you anticipate when the market might shift. These regular updates can point out subtle changes in supply and demand dynamics. Think about how a change in employment figures can ripple through consumer spending and, in turn, affect demand for things like agricultural products or manufactured goods.
Taking a closer look at different market sectors can sharpen your analysis even more. Energy markets often react sharply to geopolitical events or weather forecasts that change supply expectations. In agriculture, contract details such as quality grading or delivery conditions can influence pricing decisions, while metal futures might quickly bounce due to global supply hiccups or shifts in industrial demand.
Key drivers to keep an eye on include:
- GDP Releases – Reflect overall economic momentum.
- Employment Reports – Indicate trends in consumer confidence and spending.
- Inflation Data – Shape cost structures and pricing decisions.
Monitoring these fundamentals alongside specific contract details creates a clear roadmap for turning big-picture economic data into practical trading insights.
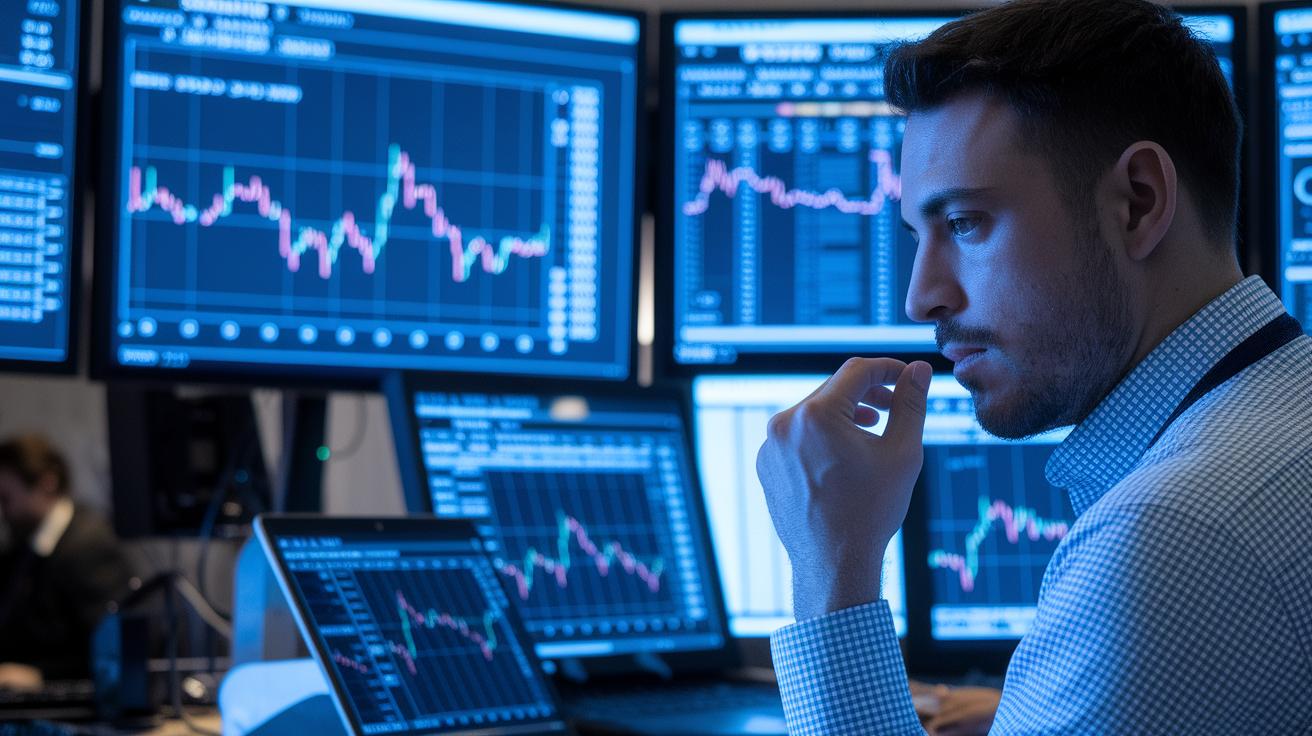
Quantitative Models and Statistical Tools in Futures Market Analysis
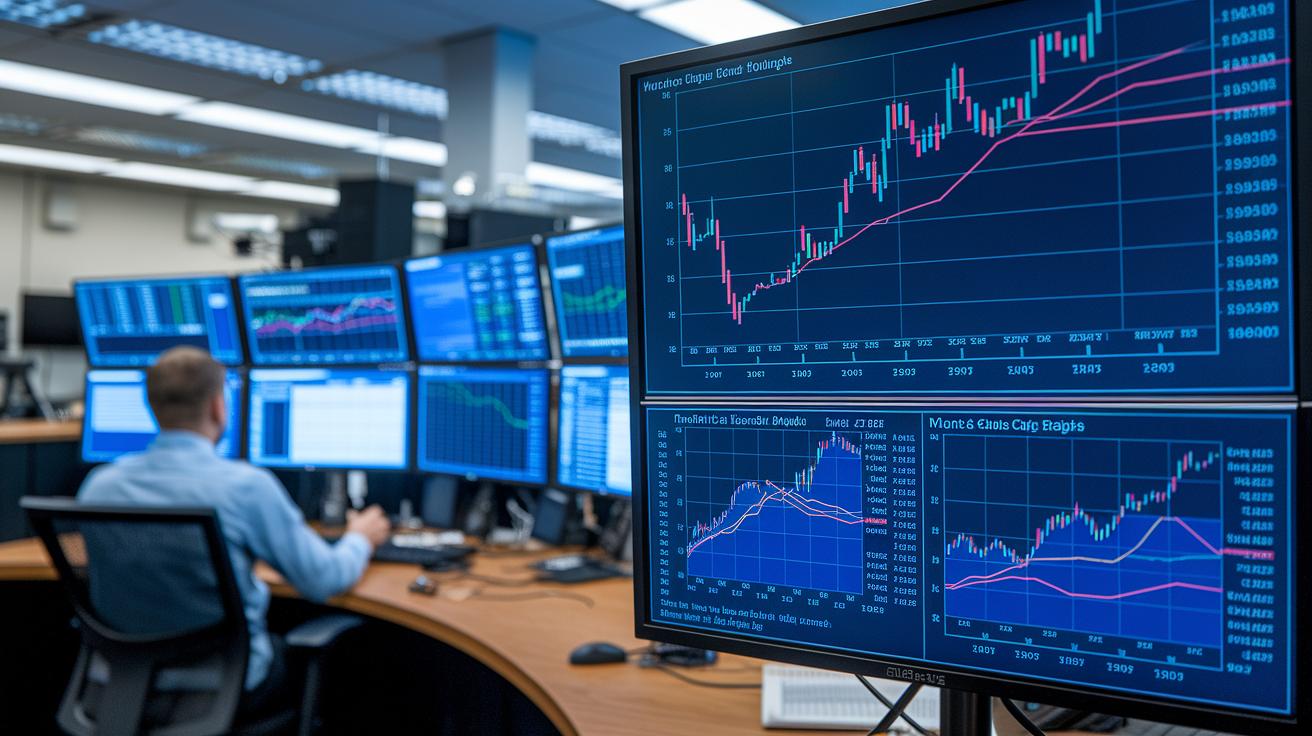
Traders looking to gain an advantage in the futures market are increasingly using quantitative models to turn raw data into clear, actionable insights. They start with regression analysis to uncover hidden connections between different markets, using simple metrics to see how various assets move together. And then there’s the Monte Carlo simulation, a method that runs thousands of simulated price scenarios so traders can plan for unexpected twists in the market.
The approach doesn’t stop there. Stochastic models help traders understand price swings by evaluating volatility, which is vital when market movements feel random. Alongside these methods, thorough back-testing checks that trading strategies work well in practice. This process often reveals tiny pricing quirks that can be exploited through statistical arbitrage, helping traders make every move count.
When it comes to measuring performance, choosing the right tool is key. Traders look at each method's main metric to decide which to use for assessing relationships, testing scenarios, or modeling price randomness. Take a look at the table below for a quick comparison:
| Model | Key Metric | Best Use Case |
|---|---|---|
| Regression Analysis | Correlation Coefficient | Tracking market relationships |
| Monte Carlo Simulation | Confidence Intervals | Testing scenarios for risk |
| Stochastic Model | Volatility Estimation | Modeling random price movements |
| Back-testing Procedure | Strategy Performance | Validating trading strategies |
These statistical tools seamlessly convert hard-to-read data into a clear method for understanding risks and spotting trends. With every trading decision backed by solid analysis, traders can navigate the market with greater confidence and clarity.
Risk Management and Execution Strategies in Futures Market Analysis
Traders can strengthen their analysis of the futures market by using smart risk control strategies that safeguard their portfolios during sudden shifts. One key approach is position sizing, this means dividing your capital into specific portions based on clear exposure limits so that one bad trade won’t wipe you out. Also, setting up strict stop-loss orders, triggers that automatically close a position when the market moves beyond a set point, acts as a quick safety net when market vibes suddenly change.
Another important aspect is checking market liquidity. Knowing how deep the market is can help ensure that trades execute at good prices and reduce the risk of slippage, especially when things move fast. Think of it like this:
- Set clear risk limits based on your total funds and the amount you’re willing to risk per trade.
- Define your entry and exit points by using predetermined stop-loss levels.
- Check market depth to make sure the liquidity supports seamless trade execution.
Advances in electronic trading, such as order flow analytics and smart order routing, are also game changers. They provide real-time insights on order fills, which means you can fine-tune your entry and exit moments to cut down on execution costs. In short, blending solid risk management with tactical trade execution transforms raw market data into a disciplined, actionable trading approach.
Sentiment and AI Integration in Futures Market Analysis
Blending sentiment analysis with AI is changing the way traders watch the futures markets. Picture this: AI scans news headlines and social chatter in real time, picking up on the market’s mood as events unfold. It works by spotting statistical oddities and tweaking momentum tools so traders can sort out the useful signals from all the background noise.
Traders mix these smart machine-learning methods with traditional technical analysis to uncover subtle shifts that might otherwise be missed. Imagine a breaking news story so powerful that it sends trading systems recalculating positions in mere seconds. That’s the magic of these advanced algorithms, processing data at lightning speed while human eyes just can’t keep up. And with contemporary dashboard tools, traders can follow these quick changes as they happen.
Here are a few concrete examples where AI makes a big difference:
| Use Case | Description |
|---|---|
| Real-time anomaly detection | Algorithms catch unusual market behavior at the moment it occurs, acting as an early warning. |
| Sentiment filtering | Machine learning models sharpen buy and sell signals by analyzing the live sentiment data. |
| Expert trend adjustment | AI fine-tunes momentum indicators to spot early trend reversals, adding a predictive edge. |
By embracing these advanced tools, traders can make futures market analysis more timely and actionable. It’s a game-changer, giving them a fresh perspective in a rapidly shifting marketplace.
Final Words
In the action, the blog post took you through technical chart patterns, key economic drivers, quantitative models, robust risk methods, and innovative AI insights. Each section offered clear ways to read market signals, from moving averages and support levels to regression metrics and smart sentiment tools.
This futures market analysis aimed to give you practical methods for solid decision-making. It’s all about applying these ideas to stay sharp, confident, and ready for emerging trends ahead.
FAQ
What is a futures market analysis chart and where can I get futures charts?
A futures market analysis chart displays price trends and trading volumes. Traders can access these interactive charts on many real-time trading platforms that offer detailed market data and analysis tools.
How can I access free futures market analysis?
Free futures market analysis is available on various financial news sites and trading platforms. These resources provide basic insights and charting tools for those beginning their market research.
What does futures market analysis mean for forex trading?
Analyzing futures in forex involves examining currency futures contracts to spot trends. This method combines technical measures and economic data to evaluate potential movements in the foreign exchange market.
What are stock market futures for tomorrow?
Stock market futures for tomorrow reflect market expectations for the next trading session. They offer a preview of investor sentiment and potential price changes based on overnight events and economic developments.
What do Nasdaq futures indicate?
Nasdaq futures indicate how tech-heavy market indices might perform. They act as early signals of investor sentiment and economic trends before the stock market officially opens.
What is provided in a futures fundamental analysis PDF?
A futures fundamental analysis PDF explains how economic indicators like GDP, employment, and inflation affect commodity prices. It helps traders understand underlying factors that drive price movements in futures contracts.
How often do futures predict the market?
Futures predict the market by reflecting collective trader expectations and reactions to economic news. Their accuracy varies with market conditions, offering useful hints about potential future trends rather than guarantees.
How do futures compare to options?
Futures require traders to meet contract obligations at expiration, while options offer the right—but not the obligation—to trade. This key difference affects risk levels and trading strategies for each instrument.
What does the 80% rule in futures trading refer to?
The 80% rule suggests concentrating on trades with an 80% probability of success. This guideline helps traders manage risk and focus on opportunities that offer stronger prospects for favorable outcomes.
How should futures trading be analyzed?
Futures trading analysis combines technical indicators, chart patterns, and economic fundamentals. Traders review moving averages, volume trends, and data models to form a comprehensive view that supports informed decision-making.
What does the 60/40 rule in futures trading mean?
The 60/40 rule advises splitting investments between more volatile positions and safer assets. This strategy helps maintain balance—optimizing potential returns while keeping risks under control.

